We come to you after the ring of the closing bell at 4 PM in New York.
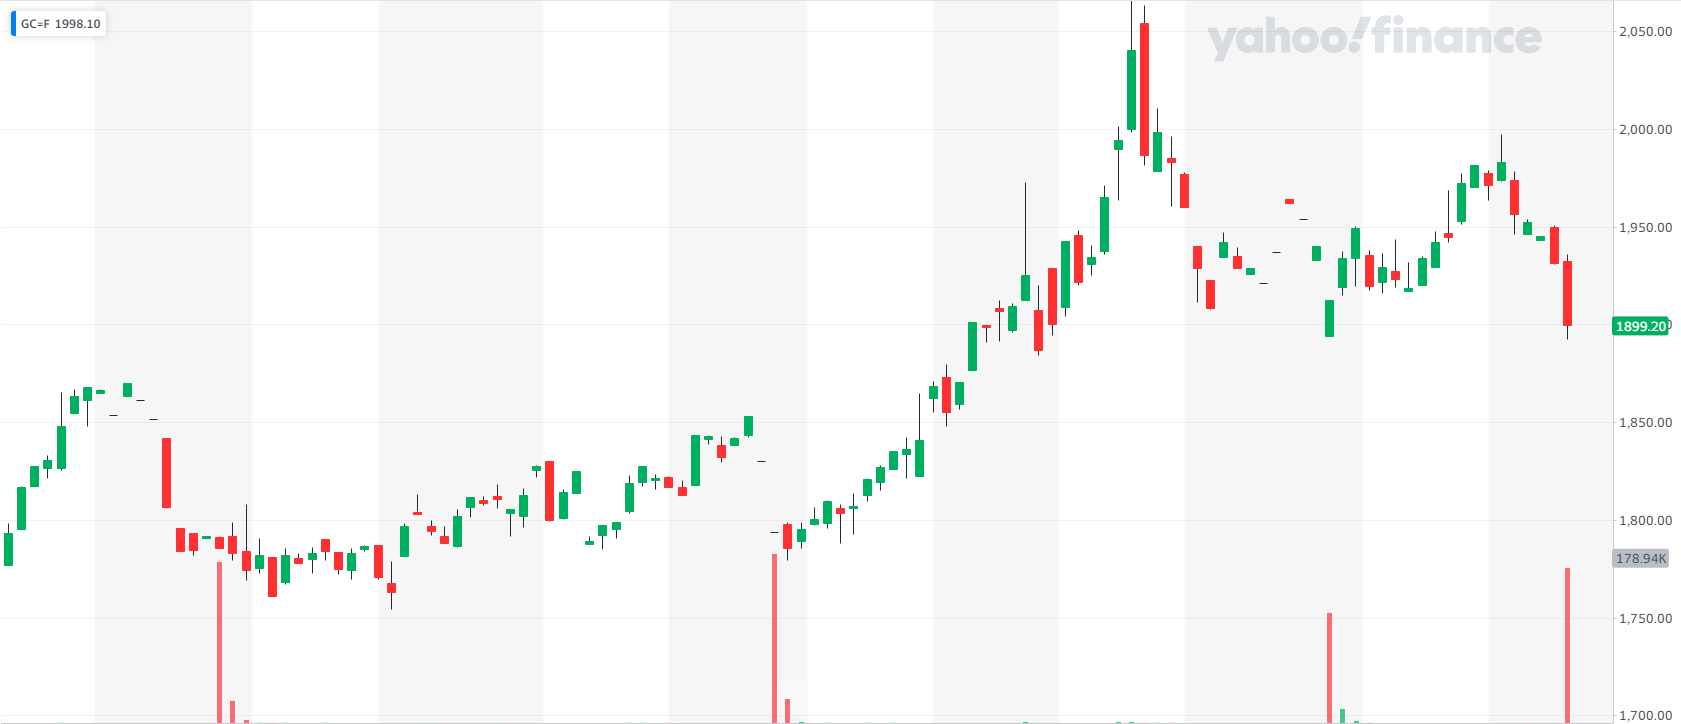
Today on the 25th of April in the gold chart was down roughly …% and the closest commodity to it with a …% in the Silver chart. Gold, which has held up strong in the bear market has today experienced an increased drop after a already weakening price, which wiped out most gains during that time frame.
The huge spike in volume today combined with that drop leads us to believe that the most of that was long covering as investors saw their order's profit sinking over the last weeks.
 Source
Furthermore we see a difference in open interest to actual volume in gold futures.
 Source
All that indicates a short term drop while the future looks bright due to the fundamental indicators such as high inflation and investor’s anticipation of a market crash, which has always helped gold go up in price.
To sum it up again, gold has a bright future and can now be purchased at a discounted price.